


Whether you're planning a homestead or farm, your success depends on your land’s natural features. The shape of the land, how water moves through it, where the sun shines most, and what wildlife lives nearby all play a critical role in how productive and resilient your property can be.But far too often, people buy or build on real estate without really understanding its features. They find out the hard way when water pools in the wrong place, the garden struggles in the shade, or buildings are poorly oriented for passive solar heating. These missteps aren’t just frustrating; they can be expensive or even irreversible.
Fortunately, next-generation contour maps and other property analysis tools are making planning smarter from the start easier and faster than ever. With just a few clicks, people can now access high-quality insights that used to cost thousands of dollars in surveyor fees and took weeks, even months, to produce.
In this article, we’ll explore how these tools work, what kind of data they provide, and how you can use them to design a resilient, self-sufficient property that works in harmony with nature, not against it.
What is a contour map, and why does it matter?
A contour map is a two-dimensional representation of a three-dimensional surface. It reveals the shape of the land: Hills, valleys, slopes, and elevation changes. These lines are essential for understanding how water will flow, where the sun will hit, and which areas are most vulnerable to erosion, flooding, or frost pockets on a given landscape.
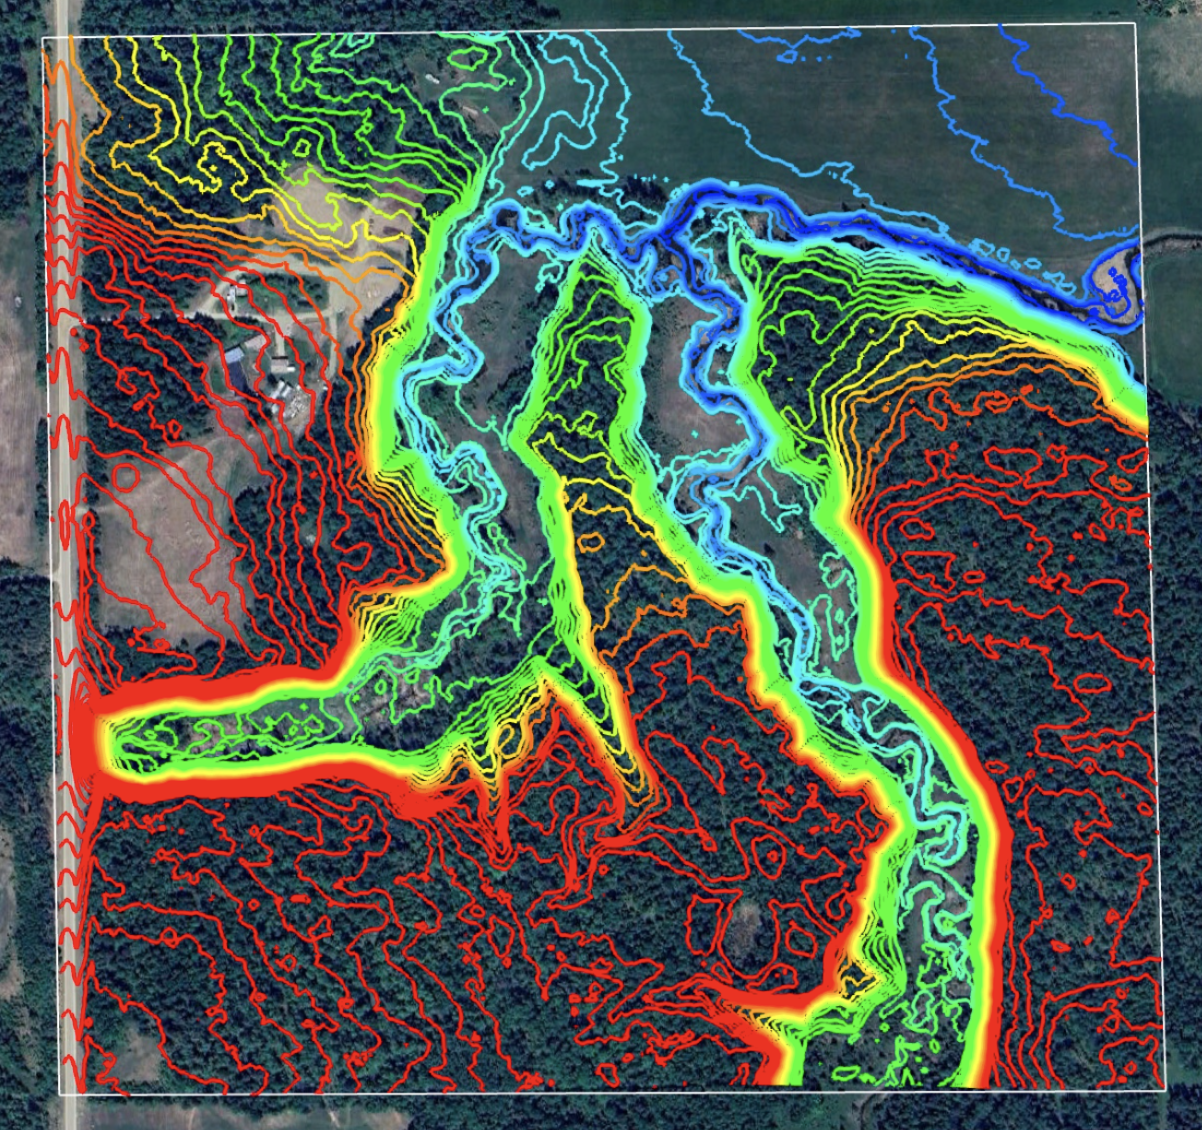
Therefore, when you're planning property features such as buildings, orchards, solar arrays, rainwater harvesting systems, or garden beds, your land’s topography can make or break the project. And while walking the land gives you a sense of it, contour maps give you precision.
Rob Avis, a renowned permaculturist and Chief Engineering Officer at the regenerative homestead company 5th World, regularly relies on contour maps to inform property design during the diagnostic phase.
“A map is the closest thing a designer and land manager has to a Rosetta Stone,” said Rob. “It’s a non-linear tool that allows you to capture enormous amounts of data on a single page. If a picture is worth 1,000 words, a map is worth 50,000.”
What’s more, people are now able to acquire not just contour maps, but other data layers for a more comprehensive understanding of their property. For example: Local drainage network and expanded water catchment, biodiversity, and climate patterns. Used together, this data can help optimize homestead or farm planning—making the absolute best of the land’s natural features by identifying its challenges and opportunities.
 Less Intensive Farming Boosts Soil Health
From data to design
Online property analysis tools leverage interactive user interfaces, enabling people to enter their property’s location and draw its boundaries directly. Then, the software uses data sources such as Google Earth Pro and iNaturalist to create the requested property maps and reports. These are delivered by email and can take just minutes to arrive.
“When I first started teaching regenerative property design, I instructed students to draw maps by hand,” said Rob. “Now, we have tools like Contour Map Generator, which makes designing a breeze for any property larger than half an acre.”
With a complete analysis of the land, property features can be planned using a systems approach. Meaning, roofs, rain tanks, greenhouses, solar arrays, etc., can be designed not as stand-alone elements, but so they’re in harmony with each other and with the land.
Here is an example of a homestead whose food, water, and energy systems are interconnected and work with the land's natural features.
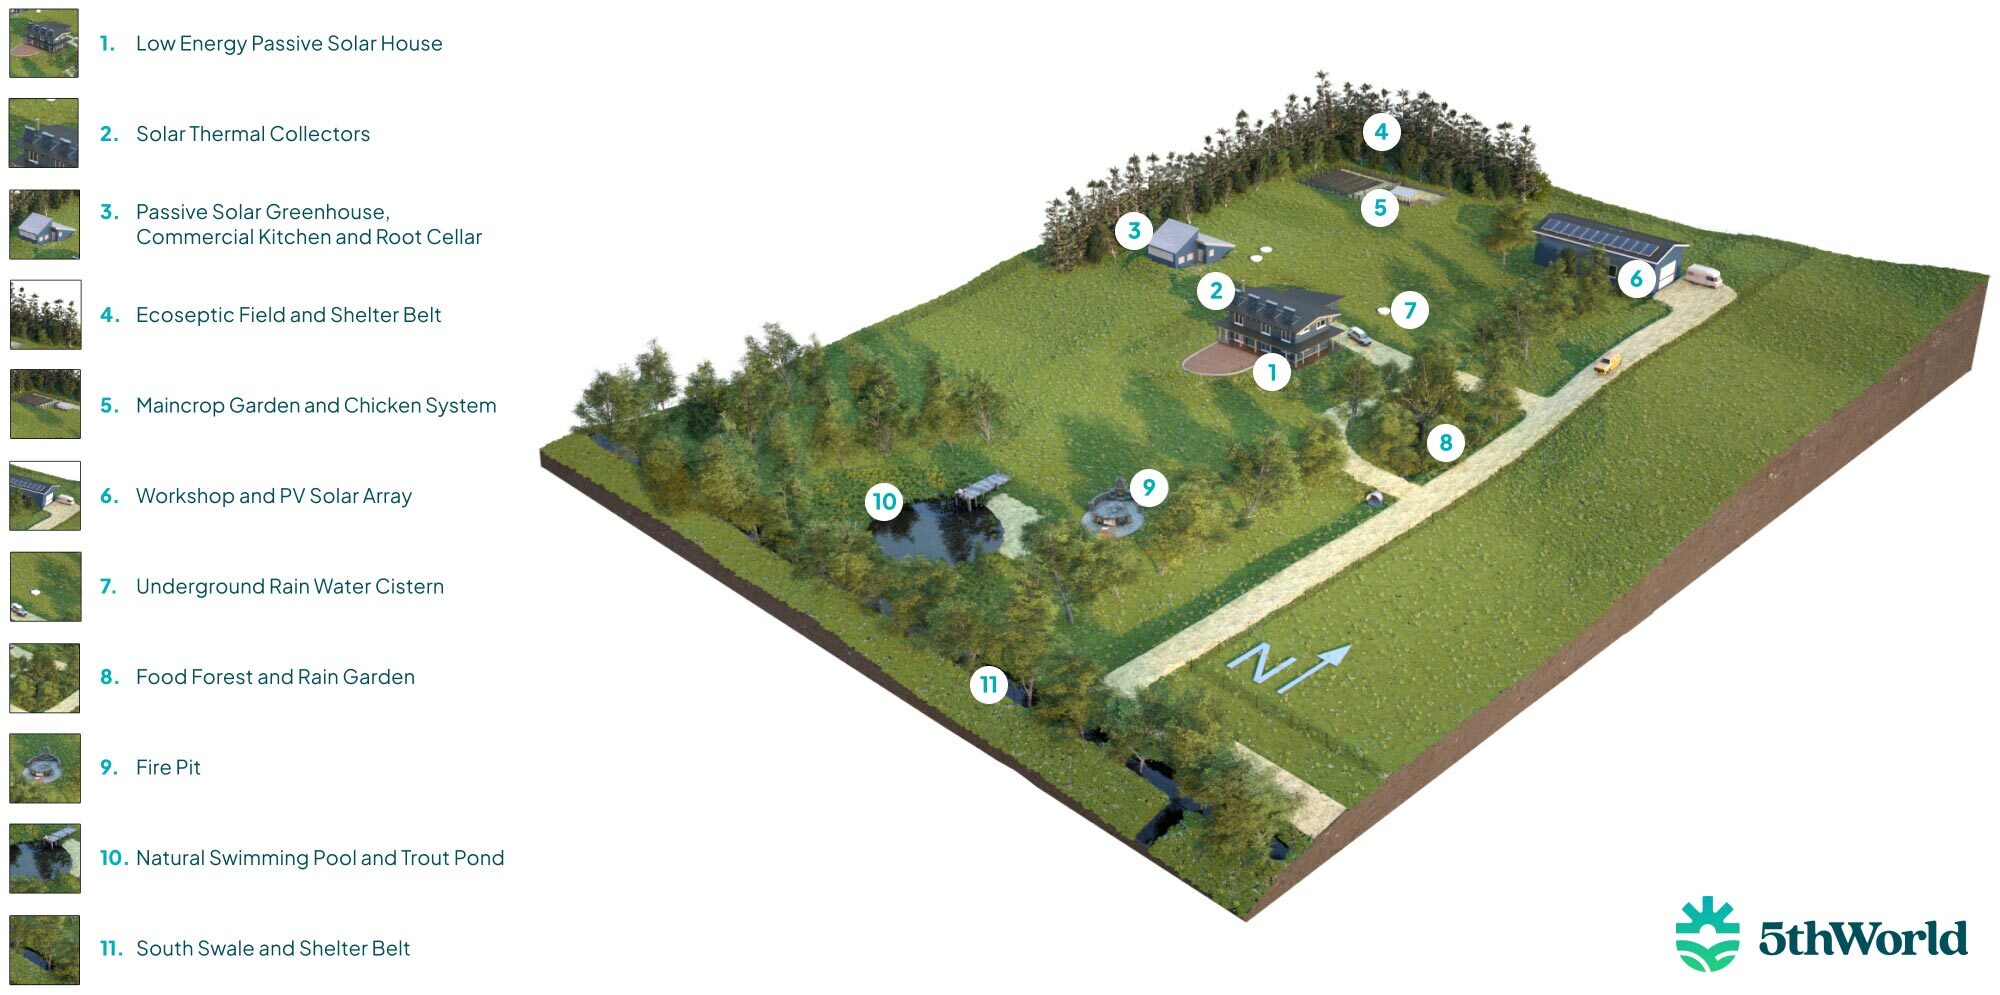
This off-grid passive solar house uses 90% less power than a conventional home: All of the power is provided by a rooftop solar array. Water is supplied via rainwater harvesting and domestic hot water is provided through a solar thermal array. The pond collects site runoff and provides irrigation water as well as fire suppression.
An on-site passive solar greenhouse—with a root cellar and canning kitchen—is designed to grow, process, and store the food for the property.
Practical applications for homesteads and farms
Here’s how water, sun, biodiversity, land, and climate data can be used to guide real-world decisions on your property:
1. Water
Understanding how water moves through your property is essential for everything from flood prevention to water harvesting. Specifically, drainage networks show how rainfall or snowmelt flows, helping you place swales, ponds, or culverts in the most effective spots. And expanded catchment data reveals the upstream conditions that might affect your land, like flash flood risks or drought-prone regions.
Use case: Avoid building in a low-lying area with a high water table and instead site your buildings, gardens, and crops on well-drained ground.
2. Sun
Sunlight is a limited and valuable resource—especially in colder climates or shaded terrain. Solar exposure maps pinpoint where you’ll get the most light on critical dates like the winter solstice, helping you plan your solar panels, greenhouses, and food production zones for maximum efficiency.
Use case: Place your orchard on a south-facing slope that gets full sun, while locating your root cellar or storage shed in a naturally cooler, shadier area.
3. Biodiversity
Understanding local ecosystems helps you support native species, manage pests, and even forage or hunt sustainably. Platforms like iNaturalist can help you get a snapshot of flora and fauna identified near your property. Knowing more about local biodiversity can also help you plan plantings that attract pollinators or deter invasive species.
Use case: Design a pollinator hedgerow using native perennials and preserve forest edges that shelter beneficial wildlife.
4. Land
This is one of the most comprehensive layers, showing elevation, slope, and aspect (sun-facing direction). Slope angles identify safe spots to build, areas prone to erosion, and flat areas suitable for gardens or grazing. Hillshade and 3D simulations give a realistic feel for the land’s texture. And aspect data helps fine-tune your design for solar gain, fire risk, or microclimate nuances.
Use case: Design a gravity-fed irrigation system that moves water downhill from a storage tank placed at the highest elevation point.
5. Climate
Your land’s climate isn’t just about averages, it’s about extremes and timing. This layer includes temperature ranges, frost dates, wind roses, and precipitation trends. It enables you to align your planting schedules, water storage systems, and even firebreaks with seasonal patterns.
Use case: Use climate charts to select plant species that will thrive in your temperature range and identify wind-prone zones to shelter with trees.
Make the most of your land
Dreaming of a self-sufficient homestead? Or a productive regenerative farm?
Success starts with reading the land.