


Hollard Insure and Farmingportal.co.za and Agri News Net - Young Agri Writers awards
ANALYSIS OF POTATO SUPPLY RESPONSE TO RAINFALL, TEMPERATURE, AND HUMIDITY IN SOUTH AFRICA FOR THE PERIOD 1996-2022
ABSTRACT
Potato production in South Africa is critical for food security and economic stability, yet it faces significant challenges due to climate variability. Factors such as rainfall, temperature, and humidity directly impact the supply and quality of potatoes. Understanding the relationship between these climatic variables and potato supply is essential for developing strategies to ensure sustainability in the context of climate change. This study aims to analyze the effects of rainfall, temperature, and humidity on potato supply in South Africa from 1996 to 2022. The research provides insights into the long- and short-term relationships between climatic variables and potato production to guide farmers and policymakers in climate adaptation strategies. The study employed secondary time-series data covering 27 years (1996–2022). Statistical tools such as the Augmented Dickey-Fuller (ADF) test, Johansen cointegration test, and Error Correction Model (ECM) were used to evaluate the stationarity of the data, test for cointegration, and determine the long- and short-run impacts of climate variables on potato supply. The results revealed a significant long-run relationship between rainfall, temperature, humidity, and potato supply, while no short-run relationship was identified. Increased rainfall and temperature negatively impacted supply, whereas higher humidity had a positive effect. These findings provide valuable information for optimizing planting schedules and resource allocation. The study contributes to the broader understanding of climate impacts on agriculture and supports the development of policies promoting climate-resilient farming practices in South Africa.
Key words: climate variability, sustainability, climate change, long-run relationship, short-run relationship
INTRODUCTION
In terms of worldwide output, potatoes rank fourth and are the most significant non-grain crop (FAO, 2019). An estimated 45,000 permanent and seasonal workers are employed by the potato industry in South Africa, which has a primary market value of R7.5 billion and a secondary market value of R26 billion. Raymundo et al., (2020) concluded that it is important to study climate change impacts on potato yields as it is crucial for future food security, the study further indicates that with proper adaptations yields could potentially increase by 9% to 20% despite climate challenges. On average, the industry plants between 50,000 and 60,000 hectares of potatoes, which accounts for 45% of all vegetable crops produced in the nation (PSA, 2021). It boosts the economy of South Africa by generating jobs, which in turn promotes food security in the nation. Because of its high yield, versatility as a crop in many cropping systems, and high-quality output per unit input within a shorter crop cycle, potatoes are seen as a crop with considerable potential for ensuring food security (Goffart, 2021). Due to its diverse distribution pattern and current production and demand, improving potato crop productivity and production can help to match the four dimensions of food security: food availability, food access, food use and quality, and food stability, especially in developing nations where poverty, hunger, and malnutrition are common (Jasmin et al., 2020). Global warming exacerbates the effects of high heat and drought, which lower potato yields and quality (Muthoni, 2020). South Africa's crop output has been negatively influenced by extreme weather events, endangering the country's food security (IPCC, 2007; Nhamo, 2019). Changes in the crop-growing season and severe droughts, like those that occurred in 1982/1983, 1987/1988, 1991/1992, 1994/1995, and 2002/2003, have previously occurred in South Africa (BFAP, 2016; Cotago, 2019). This kind of climate change will probably result in a decline in overall crop productivity, with significant regional differences (Ray et el., 2019). Higher temperatures brought on by climate change are predicted to increase the frequency of high-stress events (Frake, 2020).
Potatoes are an important food crop that are easy to manage and takes less time to grow and produce, making it a less expensive source of food energy (Katea et el., 2017) as a result the potato industry provides employment and income for many people, however, weather variability poses a significant risk to the potato industry, and understanding the effects of weather variability is essential for ensuring the industry’s long-term sustainability. Efficient resource allocation is essential for optimizing potato production. By examining the supply of potato response to rainfall, temperature, and humidity, policymakers, farmers and stakeholders can gain valuable insights into the optimal allocation of resources and inputs such as irrigation, fertilizers, and pest control measures. Despite the importance of understanding the potential of potatoes to contribute to a climate-smart future, there has been a lack of previous potato modelling studies compared to other crops, especially on a global scale (Hijmans, 2003). Detailed information on the effects of abiotic environmental factors (that is drought, floods or temperature) is essential, as these conditions are difficult to predict (Pimentel et el., 2004).
South Africa's potato production is highly sensitive to climatic variations. Changes in rainfall patterns, humidity levels, and temperature extremes directly impact crop yields and farming practices. South Africa is experiencing significant changes in climate, including rising temperatures and altered rainfall patterns. These changes pose a threat to potato production, which is sensitive to climatic conditions. Understanding how these factors affect potato supply is crucial for developing adaptive strategies to mitigate yield losses due to climate variability (Franke, 2013). Potatoes are a vital food source and cash crop in South Africa, contributing to food security and economic stability for many smallholder farmers. Analyzing the relationship between climate variables and potato supply can provide insights into how to sustain and enhance production levels to meet the growing food demands of the population (Engelbrecht 2015).The population of South Africa depends on the current food system to be sustainable; however, the pillars of food security are being negatively impacted by climate change, placing pressure on the food system (Mbow, 2019). Crop output has already been shown to be strongly impacted by climate change (Raza, 2019). There has been a dearth of studies on potato modelling, particularly on a global scale. Aekanmbi et al. (2024) are one of the few examples because this study only looks at the effects of temperature and rainfall; it does not take into account the effects of humidity on potato supply. Global climate change is currently a major challenge that has drawn substantial attention (Li Q, 2020). According to projections made by Johnson et al. (2024), there will be a notable increase in the frequency and duration of heatwaves and droughts in South Africa, along with a rise in heavy rainfall in the country's eastern regions. These changes will have a substantial effect on the country's potato supply. One of the key elements influencing plant growth and development as well as potato production is temperature (Wang, 2021). Prolonged low temperatures tend to impede potato development and reduce potato supply. Because potatoes are susceptible to frost, low temperatures can result in serious damage (Li H, 2021).
The present study builds on the work of Franke (2020) that assesses the impact of climate change on yield and water use efficiencies of potatoes in different production regions of South Africa. The present study incorporates humidity, adding a dimension to understanding how moisture levels influence potato supply. The present study also provides specific insights into long-run relationships among the climate factors and potato supply, advising both policymakers and farmers on sustainable practices. The objectives of the study were to describe and summarize the trends in rainfall, temperature, humidity and the supply of potatoes in South Africa for the period 1996-2022 and to test for the short and the long-run relationship between rainfall, temperature, humidity and the supply of potatoes in South Africa. The analytical techniques used are Augmented-Dickey Fuller (ADF) test to test for stationarity among the variables, then the VAR lag order selection criteria was used to ensure the correct number of lag was used and to ensure the model accurately captures the relationship among the variables. Johansen cointegration test was used to check for the cointegration relationship, then the Error Correction Model (ECM) was used to test for the long and the short-run relationship.
This paper is arranged as follows: Section 2 represents the literature review, section 3 presents the research methodology, Section 4 presents the results and discussions, and section 5 presents the study conclusions.
MATERIALS AND METHODS
This study used publicly available secondary time series data from the years 1996-2022. The choice of sample size was dictated by data availability across all variables under study. The data used in this study was obtained from Trading Economics, Power Access Climate data, and DARRLD. The annual data of a 27-year timeframe was covered for potato supply, temperature, humidity, and rainfall. The analysis of this study was done using EViews 12. The study used descriptive and econometric analysis to analyse the data collected. The table of variables is presented in table 1 below.
Table 1: table of variables
|
DATA |
SOURCE |
MEASUREMENT |
YEARS |
|
Rainfall |
Trading Economics |
MM |
1996-2022 |
|
Temperature |
Trading Economics |
DEGREES CELCIUS |
1996-2022 |
|
Humidity |
Power Access Climate Data |
Percentage |
1996-2022 |
|
Potato supply |
DARRLD abstract |
Tons |
1996-2022 |
This study used descriptive statistics and graphs to address the first objective of the study which was to describe and summarize the trends in rainfall, temperature, humidity and the supply of potatoes in South Africa for the period 1996-2022
Investigating Unit Root
The ADF test was used to test for stationarity on the specified variables which are rainfall, temperature, humidity, and potato supply. The ADF model that was used in this study is as follows (Pierre et el., 1992):
………………………………………………………….(1)
Where σ=ά-1
ά=the coefficient of yt-1
Δyt=The first difference of yt
If the null hypothesis is not rejected the series is non-stationery whereas rejection means stationery
Johansen cointegration test
Johansen cointegration test was used in this study to determine the existence of cointegrating relationship among the variables. The presence of at least one cointegration relationship among the variables is important for the analysis of long and short-run relationships to be credible (Du-preez, 2011). The study used the two Johansen’s test statistics, namely the Eigen statistic and Trace statistic.
The maximal-Eigen Statistics is given by: (Varva and Goodwin, 2005)
𝜆max = -T log(1-𝜆̂r+1) r = 0, 1, 2, … …, n-1………………………………………..….(2)
Where T is the sample size and (1-𝜆̂r+1) is the Max-Eigen Statistic estimate.
The trace statistic is given by:
𝜆trace ) r =0, 1, 2, … …, n -1 ……………………………………………..(3)
Error Correction Model
The ECM model was used to separate the short-run and long-run relationships between the variables, allowing the analysis of both contemporary and equilibrium relationships. The ECM model used in this study is written as follows (Hasem et el.,1999):
Yt =μ+ß1Xt+et…………………………………………………………………………………….(4)
A link between the cointegration and Error Correction Model (ECM) is established by transforming the cointegration equation between Y, and X, are as follows:
Et = Yt-μ-B1Xt
RESULTS AND DISCUSSION
The results are presented and briefly analyzed in four subsections. The first subsection discusses descriptive statistics (table 2) and the trends for all the variables from 1996-2022, the second subsection the results from the Augmented-Dickey fuller test (table 3), the third subsection discusses the results of Vector Autoregression Lag Order Selection (table 4), section four discusses the Johansen cointegration test (table 5 and table 6) then the last section discusses the Error Correction Model (table 7).
The analysis starts by deriving descriptive statistics of the data series for each variable. The results for descriptive statistics are presented in Table 1 below.
Table 2: Descriptive Statistics Results
|
Variable |
Rainfall (mm) |
Temperature (degrees Celsius) |
Humidity (%) |
Potato supply( thousand tons) |
|
Mean |
474.88 |
18.28 |
44.37 |
2084.89 |
|
Median |
468.95 |
18.33 |
44.19 |
1979.00 |
|
Maximum |
693.02 |
19.27 |
49.50 |
2681.00 |
|
Minimum |
374.29 |
17.33 |
36.94 |
1496.00 |
|
Standard deviation |
72.85 |
0.43 |
2.96 |
378.35 |
Source: own elaboration
Table 1 presents the mean, standard deviation, median, maximum and minimum of the series. On average the potato supply was 2084.89 thousand tons with a standard deviation of 378.35 thousand tons. The average rainfall was 474.88 mm with a standard deviation of 72.85 mm. The average temperature was 18.28 °C with a standard deviation of 0.43 °C. The average humidity was 44.37% with a standard deviation of 2.96%. The table shows that the minimum values of rainfall, temperature and potato supply are close to the mean indicating a large variation or spread. For humidity the maximum value is close to the mean indicating a low variation or spread indicating that humidity does not have a significant impact on the supply of potatoes.
Trend analysis of the variables from1996-2022
The trends in potato supply, humidity, average temperature, and average rainfall are presented graphically below in figures 1 to 4.
Figure 1: line graph for potato supply
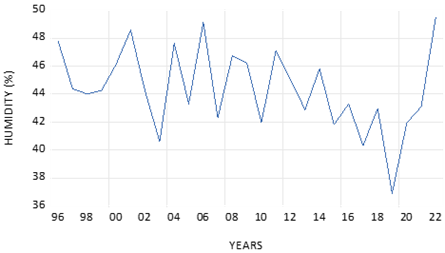
Figure 2: line graph for humidity
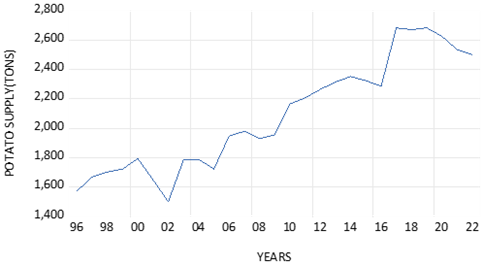
Figure 3: line graph for temperature
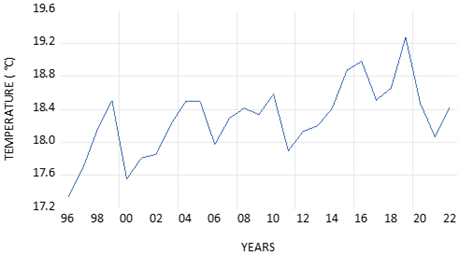
Figure 4: line graph for rainfall
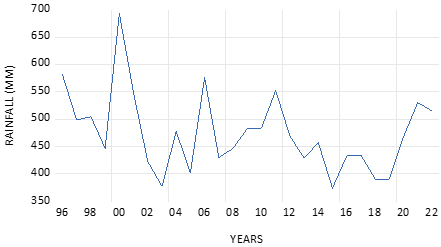
The graphs show the upward and downward trends for all the variables over time, with potato supply measured in 1000 tons (t), the average temperature in degrees Celsius (°C), rainfall in millimetres (mm), and humidity in percentage. The visual inspection shows that when rainfall increases, humidity also increases. When the level of rainfall received is too high the supply decreases meaning the potatoes require a certain amount of rain to grow. It also shows that potato supply can grow or can increase when temperatures are high due to high humidity levels. The supply of potatoes was low around 2002 because there was less rainfall received, the level or percentage of humidity was low and the temperatures were increasing.
The results on the analytical techniques are presented below.
The Dickey-Fuller (ADF) test
The ADF test was used to test for stationarity and the results are presented in table 2 below.
Table 3: ADF results for stationarity test
|
Variable |
Levels (p-value) |
Remarks |
1st difference (p-value) |
Remarks |
|
Humidity |
0.00 |
Stationary |
0.00 |
Stationary |
|
Rainfall |
0.00 |
Stationary |
0.00 |
Stationary |
|
Temperature |
0.01 |
Stationary |
0.00 |
Stationary |
|
Potato supply |
0.73 |
Non-stationary |
0.00 |
Stationary |
Using the unit root test, humidity, rainfall, and temperature were stationary at levels and the null hypothesis was rejected because the value of p is less than 0,05. Only potato supply was not stationary at levels therefore the null hypothesis was accepted because the value of p was greater than 0,05. All variables were stationary at 1st difference with all the values of p being less than 0.05.
Lag order selection
The lag selection was conducted to select the number of observations to use in making the predictions, the results for the automatic lag selection are presented in table 4.
Table 4: Automatic lag selection
|
Lag |
LogL |
LR |
FPE |
AIC |
SC |
HQ |
|
0 |
-228.0002 |
NA |
106245.5 |
20.08697 |
20.23508 |
20.12422 |
|
1 |
-199.6950 |
46.76517* |
20037.12* |
18.40826* |
19.00069* |
18.55725* |
|
2 |
-194.4197 |
7.339544 |
29092.99 |
18.73214 |
19.76890 |
18.99289 |
|
3 |
-191.3855 |
3.429966 |
55451.15 |
19.25091 |
20.73199 |
19.62340 |
|
4 |
-187.1988 |
3.640550 |
109900.44 |
19.66946 |
21.59487 |
20.15370 |
*indicates lag order selected by the criterion, LR: sequential modified LR test statistic (each at 5% level), FPE: Final prediction error, AIC: Aike information criterion, SC: Schwarz information criterion, HR: Hannan-Quinn information criterion. The LR, FPE, AIC, SC and HQ criteria all suggest that the optimal lag length is 1.
Johansen cointegration test
The Johansen cointegration test results are presented in Table 4 indicating a long-run relationship among the variables.
Table 5: Johansen cointegration test results (Trace Statistics)
|
Hypothesized No.of CR(s) |
Eigenvalue |
Trace Statistic |
0.05 Critical Value |
Probability |
|
None* |
0.716091 |
62.02705 |
47.85613 |
0.0014 |
|
At most 1* |
0.532270 |
30.54953 |
29.79707 |
0.0409 |
|
At most 2 |
0.349380 |
11.55293 |
15.49471 |
0.1797 |
|
At most 3 |
0.031771 |
0.807176 |
3.841465 |
0.3690 |
Trace test indicates 2 cointegrating eqn(s) at the 0.05 level
*denotes rejection of the hypothesis at the 0.05 level
The test was performed focusing on the relationship between potato supply and the climate variables which are rainfall, temperature and humidity. The results suggest the rejection of the null hypothesis of no cointegration relationship between the variables. This implies that there is cointegration relationship between the variables, the results also suggests that there is a long-run relationship between the variables. Granger and Engle (1987) If two variables are cointegrated, the relationship between them can be expressed as Error Correction Model (ECM).
Table 6: Johansen cointegration test results (maximal-Eigen statistic)
|
Hypothesized No.of CR(s) |
Eigenvalue |
Trace Statistic |
0.05 Critical Value |
Probability |
|
None* |
0.716091 |
31.47752 |
27.58434 |
0.0150 |
|
At most 1 |
0.532270 |
18.99660 |
21.13162 |
0.0969 |
|
At most 2 |
0.349380 |
10.74576 |
14.26480 |
0.1674 |
|
At most 3 |
0.031771 |
0.807176 |
3.841465 |
0.3690 |
Trace test indicates 2 cointegrating eqn(s) at the 0.05 level
*Denotes rejection of the hypothesis at the 0.05 level
The maximal-Eigen statistics test was performed focusing on the relationship between potato supply and the climate variables which are rainfall, temperature, and humidity. The results suggest accepting the null hypothesis of no cointegration relationship between the variables. This implies that there is no cointegration relationship between the variables, the results also indicate that there is no long-run relationship between the variables. Harris (1995) indicates that when one test indicates cointegration (such as trace statistics test), it is typically sufficient to proceed with an Error Correction Model despite conflicting results from other cointegration tests, like the maximal-Eigen statistics.
Error Correction Model
The ECM results presented in table 6 are significant at 5% significance level.
Table 7: ECM results to test for the long and the short-run relationship
|
Variable |
Coefficient |
Std. Error |
t-statistic |
Probability |
|
C |
-8.482654 |
38.60266 |
-0.219743 |
0.8267 |
|
D Humidity (-1) |
110.1169 |
25.5053 |
4.31742 |
0.0000* |
|
D Rainfall (-1) |
-5.609561 |
0.79616 |
-7.04580 |
0.0000* |
|
D Temperature (-1) |
-786.6390 |
136.935 |
-5.74461 |
0.0000* |
|
D (Potato (-2) |
-0.62051 |
0.239012 |
-2.596105 |
0.0114* |
|
D (Humidity (-2)) |
-14.55995 |
12.99040 |
-1.12084 |
0.2661 |
|
D (Rainfall (-2)) |
0.453722 |
0.689197 |
0.658335 |
0.5142 |
|
D (Temperature (-2)) |
-29.55371 |
100.9289 |
-0.29250 |
0.5124 |
|
ECT |
0.063268 |
0.179894 |
0.351698 |
0.7261 |
|
R-squared |
0.290784 |
|
|
|
|
Adjusted R-squared |
0.093780 |
|
|
|
|
F-statistic |
1.476028 |
|
|
|
The constant has a coefficient of -8.482654, with a standard deviation of 36.60266, yielding a t-statistic of -0.219743 and a p-value of 0.8276. This suggests that the constant term is not statistically significant, indicating no constant effect on the supply of potatoes. The coefficient of humidity (-1) is 110.1169 which suggests that one unit increase in humidity from the previous period is associated with an increase in of 110.1169 in the supply of potatoes. The results are significant with a probability of 0.00. Rainfall (-1) and temperature (-1) have negative coefficients which are -5.609561 and -768.6390 respectively, indicating that an increase in temperature and rainfall in the previous period is associated with a decrease in the supply of potatoes, these results are statistically significant with a probability of 0.00. This indicates that humidity, rainfall, and temperature have a significant long-run impact on the supply of potatoes. Rainfall (-2) has a coefficient of 0.453722 which represents the change in the supply of potatoes resulting from a one-unit change in the rainfall from the previous period however, this is not statistically significant because of the probability being 0.5142. Humidity (-2) and temperature (-2) both have negative coefficients being -14.55995 and -29.55371 respectively both indicating the change in the supply of potatoes resulting from a one-unit increase in temperature and humidity. The results are not statistically significant with the probability values being greater than 0.05. The lack of significance for rainfall (-2), temperature (-2), and humidity (-2) suggests that these variables do not have a short-run impact on the supply of potatoes. The explanatory power is 29% indicating that there are other factors affecting the supply of potatoes except for the climatic variables included in this study.
A study conducted by (Dwamena, 2022) on the effects of rainfall, temperature, and humidity on the yield of cassava, yam, and maize in the Ashanti Region of Ghana concluded that an increase in maximum temperate reduces the yield of all crops while as an increase in rainfall reduces only the yield of cassava. The study used a multiple linear regression model and studied the impact of climatic variables on different commodities, but the results were similar to this study an increase in temperature reduces the supply of potatoes and also the yield of cassava, yam, and maize. The difference is only in the effects of rainfall to the different commodities, an increase in rainfall reduces the supply of potatoes and the yield of cassava while as it doesn’t reduce the yield of yam and maize. Lakatos (2023) conducted a study on climate change and potato cultivation and concluded that climate change could result to diminished potato yield due to increased temperature. The study furthermore revealed that increased temperature and suboptimal water conditions can negatively affect plant development, leaf senescence, tuber growth, ultimately affecting the potato yield. The study used active thermal sum (GDD) and this study used ECM, both studies concluded that increased temperatures decrease the supply of potatoes the study by (Lakatos, 2023) furthermore revealed that suboptimal water conditions can also negatively affect the supply of potatoes.
DISCUSSION
This study investigated the impact of climate variables (rainfall, temperature, and humidity) on potato supply in South Africa from 1996 to 2022. The descriptive statistics revealed significant variations in potato supply, rainfall, temperature, and humidity over the study period. The visual inspection of trends showed an upward and downward trend for all variables, with rainfall and humidity exhibiting a positive relationship. The Dickey-Fuller test confirmed that humidity, rainfall, and temperature were stationary at levels, while potato supply was non-stationary but became stationary at first difference. The Johansen cointegration test revealed a long-run relationship between potato supply and climate variables and also indicated that a cointegration relationship among the variables exists.
The Error Correction Model (ECM) results indicated that humidity, rainfall, and temperature have significant long-run impacts on potato supply. Specifically, a one-unit increase in humidity from the previous period increases potato supply by 110.1169 units, while a one-unit increase in rainfall and temperature from the previous period decreases potato supply by 5.609561 and 768.6390 units, respectively. However, the short-run impacts of rainfall (-2), temperature (-2), and humidity (-2) were not statistically significant because of their probability value being greater than 0.05. The explanatory power of the model was 29%, indicating that other factors, aside from climate variables, influence potato supply. As a result, the hypothesis stating that there is no long and short-run relationship between rainfall, temperature, humidity, and potato supply in South Africa was rejected. Both objectives to describe and summarize the trends in rainfall, temperature, humidity, and potato supply in South Africa from 1996 to 2022, as well as to test the existence of long and short-run relationships between these climatic variables and potato supply were successfully achieved.
The potato industry in South Africa has a great potential of contributing to the South African economy, job creation and food security as it has more chances of surviving climate change. It is important that farmers get more knowledge on climate change and its consequences. Farmers should pay more attention on the amount of rainfall received, the levels of temperature and humidity so that they can know how much to plant and when to plant it. In order for the farmers to achieve their long-term goals which are usually profit maximization and job creation, they should be able to know when to plant the potatoes and how much to plant. There should also be a need for government intervention on teaching potato farmers about the effects of climate change on the supply of potatoes and also the ways in which they can measure these climatic variables so that they will be able to know how much to plant, the government can assign extension officers to do these tasks. To mitigate the impacts of climate variability on potato supply, farmers should adopt climate-resilient agricultural practices, such as irrigation management and crop insurance. Policymakers should develop and implement policies that promote sustainable agriculture, climate change adaptation, and food security. Future studies could examine regional variations in potato supply responses to climatic variables within South Africa. This would help capture differences across provinces with diverse climatic conditions and farming practices. Future studies should also include other variables like soil quality and irrigation practices.

Manqele Zama is a 22 year old Agricultural Economics graduate with a strong interest in sustainable agriculture and climate change mitigation. Proven research skills and passion for analysing the economic impacts of climate variability on agricultural production. Skilled in statistical analysis and agricultural modelling. Proficient in EViews with strong analytical and problem solving skills“


